

Been here before? A major client had escalated to leadership because deliverables were two weeks late—and nobody on the team even knew. The account manager thought the creative lead had it covered. The creative lead assumed the project manager was tracking it. The project manager was buried in three other accounts and had lost visibility completely.
The total value at risk? $20,000 in annual revenue. Not because the work wasn’t getting done, but because nobody had a single view showing where every client stood.
This is the visibility problem that kills agencies, consulting firms, and professional services businesses. You’re not failing at execution—you’re failing at seeing the full picture. And when you can’t see the full picture, problems don’t surface until clients start complaining.
The Monday Morning Question Nobody Can Answer
Here’s a test: Right now, could you tell me the status of every active client in your business? Not by opening twelve different projects and scrolling through task lists. I mean genuinely knowing—in 30 seconds or less—which clients are in onboarding, which are in active delivery, which are waiting on approvals, and which are at risk.
If you can’t, you’re running your business blind. And you’re not alone. Most teams I work with have their project data scattered across dozens of lists, folders, and views with no unified way to see the health of their entire portfolio.
ClickUp has the capability to solve this completely. The problem is that most teams use it as a glorified to-do list instead of what it actually is: a powerful operational database. Today, I’m going to show you how to build what I call “The Big Board”—a single strategic view that becomes your command center for every client relationship in your business.
What Is The Big Board?
The Big Board isn’t another dashboard with fancy charts you’ll never look at. It’s a purpose-built List view in ClickUp that shows your entire client portfolio organized by the one dimension that matters most: who owns the relationship.
Think of it as the view a general would use to see the entire battlefield. Every client. Every account manager. Every active project. Every service being delivered. Every milestone that matters. All in one place, updated in real time as your team works.
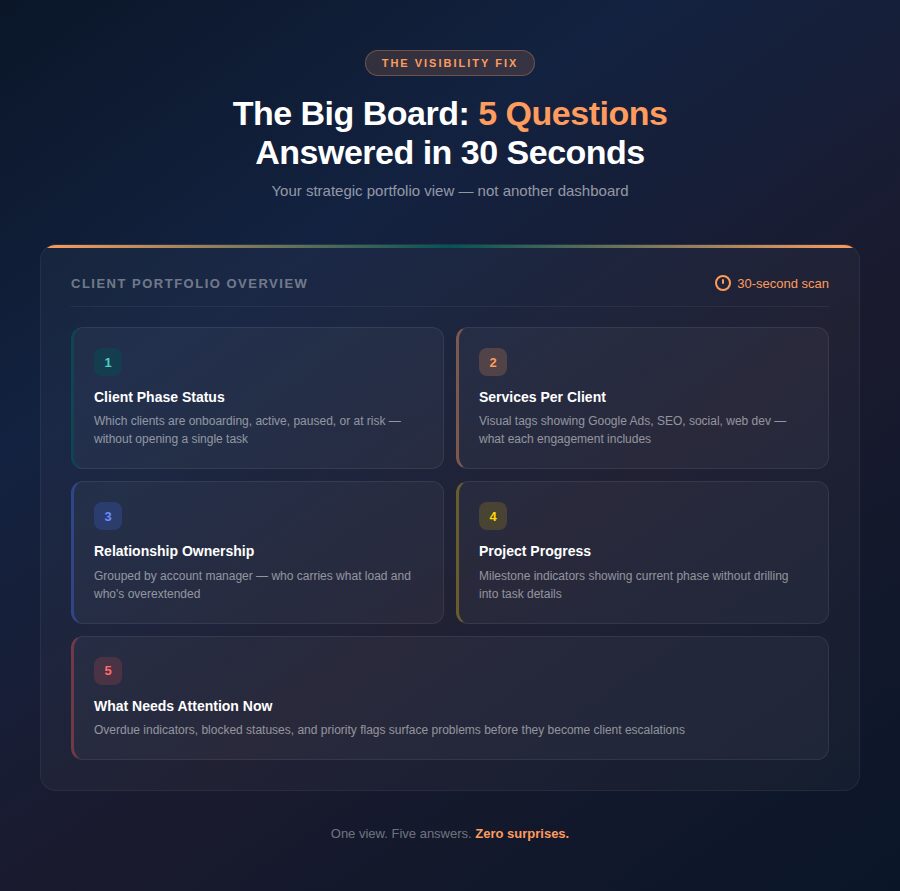
The Big Board answers five questions instantly:
1. Which clients are in what phase? Onboarding, active delivery, paused, or at risk—you see it immediately without opening a single task.
2. What services is each client receiving? Visual tags show whether a client is getting Google Ads, SEO, social media management, web development, or any combination. No more guessing what the engagement includes.
3. Who owns each relationship? Grouped by account manager, you can see at a glance who’s carrying what load and whether any one person is overextended.
4. Where do projects stand? Milestone indicators show current project phase—discovery, design, development, launch—so you know what’s in motion without drilling into task details.
5. What needs attention right now? Overdue indicators, blocked statuses, and priority flags surface the problems before they become client escalations.
Here’s What It Looks Like in Practice
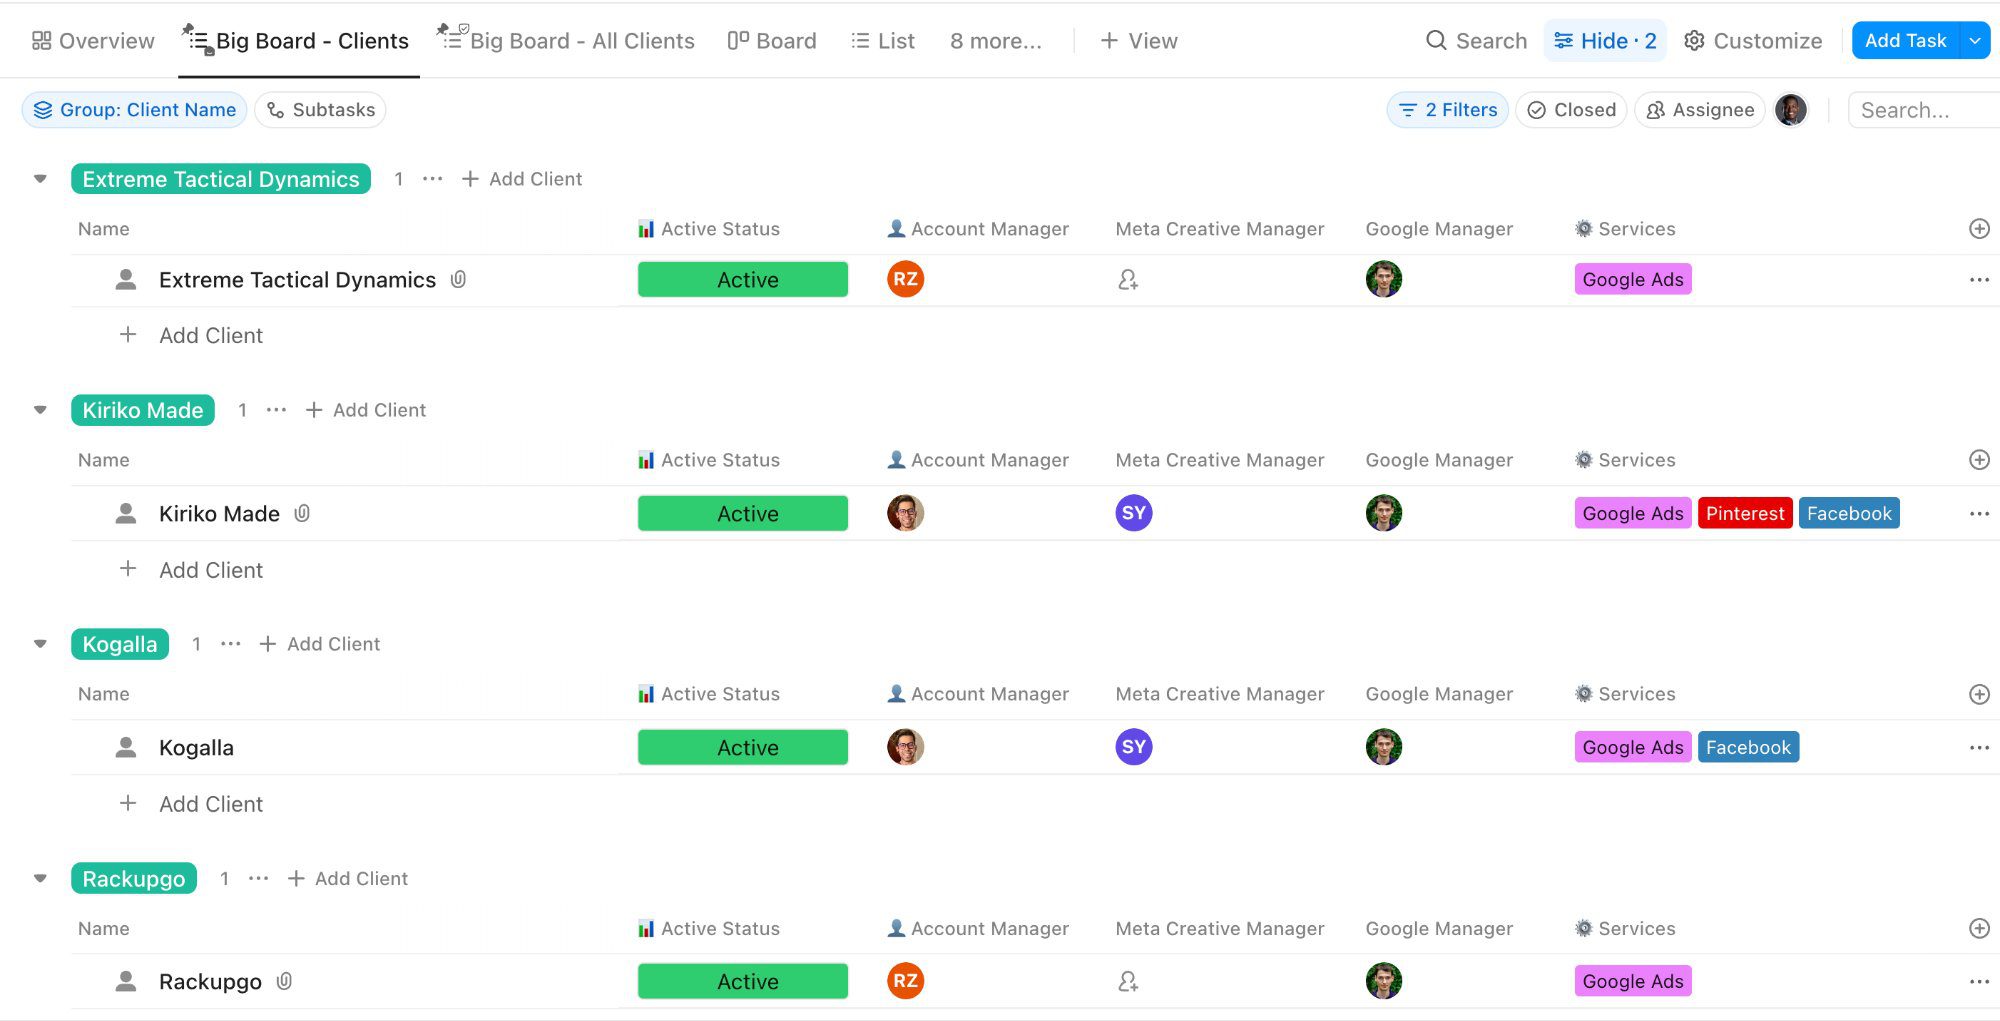
This is an actual Big Board from a client workspace. Notice how every client is grouped with their Active Status, Account Manager, Meta Creative Manager, Google Manager, and Services labels all visible at a glance. You can see in seconds who’s managing what, which services each client receives, and the status of every relationship. No clicking into tasks. No asking around in Slack.
The Foundation: Custom Fields That Make It Work
The Big Board’s power comes from the custom fields feeding it. Before you build the view, you need these fields configured at your Space level so they’re available across all client projects.
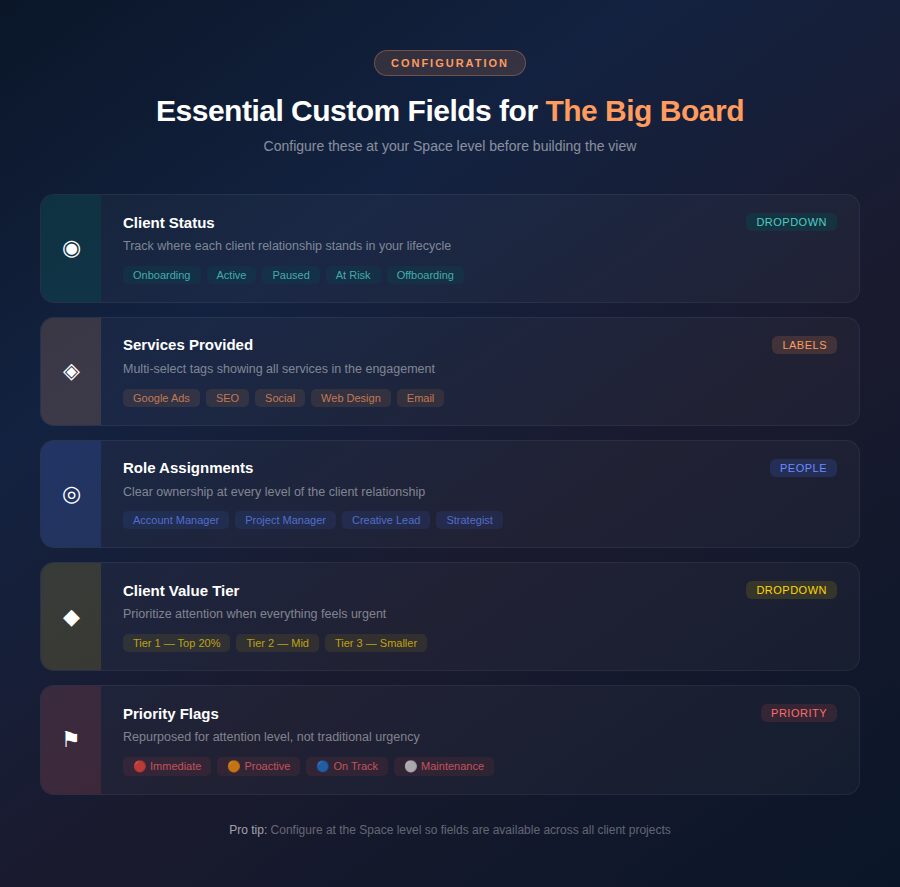
Client Status Field
Create a dropdown custom field called “Client Status” with these options:
Onboarding — New client, still in setup and discovery phase. These need extra attention and check-ins.
Active — Fully onboarded, work is in regular delivery cadence. The goal is keeping these humming without surprises.
Paused — Client has temporarily stopped work. Track these because they’re reactivation opportunities—and because tasks in flight need to be properly held.
At Risk — Something has gone wrong. Maybe deliverables slipped, maybe communication broke down, maybe the client expressed dissatisfaction. These need immediate leadership attention.
Offboarding — Client is wrapping up. Ensure final deliverables are complete, knowledge is transferred, and the relationship ends professionally.
Services Provided Field
Create a Labels custom field called “Services” that allows multiple selections. Populate it with every service your company delivers—Google Ads, Facebook Ads, SEO, Content Marketing, Web Design, Email Marketing, Social Media Management, and so on.
Labels are perfect here because they display as colorful tags in List view, making it visually obvious what each engagement includes.
Role Assignment Fields
Create People custom fields for each key role in your delivery model:
Account Manager — Owns the client relationship and is the primary point of contact.
Project Manager — Owns the delivery timeline and coordinates the team.
Creative Lead — Owns the creative output and quality.
Strategist — Owns the strategic direction and results.
You may not need all four. The point is that every client has clear ownership at every level, not just an assignee on individual tasks.
Client Value Field
Create a number field or dropdown for client value tier. You don’t necessarily need exact revenue numbers visible to the whole team, but knowing whether a client is Tier 1 (top 20% revenue), Tier 2 (middle), or Tier 3 (smaller engagements) helps prioritize when everything feels urgent.
Building The Big Board View Step by Step
Now for the actual build. This takes about 15 minutes once your custom fields are in place.
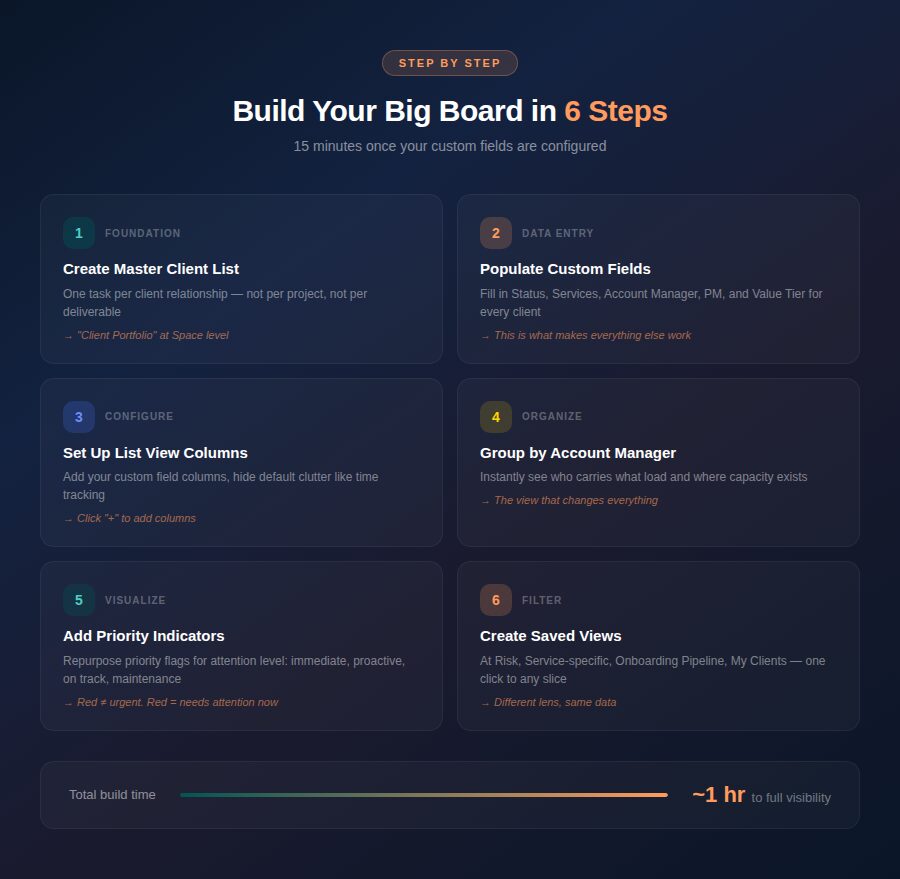
Step 1: Create a Master Client List
If you don’t already have one, create a List called “Client Portfolio” at your Space level. Each task in this list represents one client—not a project, not a deliverable, but the client relationship itself.
Name each task with the client name: “Acme Corp,” “Bright Solutions,” “Cedar & Oak.” Keep it clean.
Step 2: Populate Your Fields
For each client task, fill in every custom field: Client Status, Services, Account Manager, Project Manager, Client Value Tier. This is the data entry that makes everything else work. It takes time upfront but pays off immediately.
Step 3: Configure the List View
Open your Client Portfolio list in List view. Now configure the visible columns. Click the “+” icon to add columns and include: Client Status, Services, Account Manager, Project Manager, Priority, and Due Date (use this for next major milestone). Hide columns you don’t need like time tracking or default ClickUp fields that add clutter.
Step 4: Group by Account Manager
Click “Group by” and select your Account Manager custom field. Now every client is organized under the person who owns that relationship. You can instantly see that Sarah has six active clients, Mike has four, and your newest account manager has two as they ramp up.
Step 5: Add Visual Indicators
Use ClickUp’s priority flags strategically on client tasks—not for urgency, but for attention level:
Urgent (red) — Immediate attention needed, at-risk client or critical deadline this week.
High (orange) — Needs proactive check-in, something brewing that could escalate.
Normal (blue) — Healthy, on track, standard delivery cadence.
Low (gray) — Paused or in maintenance mode, minimal active work.
Step 6: Create Filtered Views
Save your Big Board as the default view, then create additional saved views for specific needs:
“At Risk Clients” — Filter by Client Status = At Risk. This is your weekly leadership review list.
“Service View: Google Ads” — Filter by Services containing Google Ads. See every client receiving this service and who’s managing each one.
“Onboarding Pipeline” — Filter by Client Status = Onboarding. Track new clients through their setup process.
“My Clients” — Filter Account Manager = Me. Your personal portfolio view.
The Monday Morning Ritual
Here’s how The Big Board changes your week. It’s Monday at 9:00 AM. You open one view. In 30 seconds, you see:
Sarah has two clients in onboarding and four in active delivery. One of her active clients is flagged as high priority because a campaign launch is this week.
Mike has one client marked at risk—looks like deliverables slipped last week. You can address this in your 9:30 team standup before the client even has to ask.
Your newest account manager has two clients both in active delivery. Their workload looks manageable as they ramp up.
All Google Ads clients are in healthy status. The SEO clients have one showing “paused” that’s been paused for three weeks—time to reach out about reactivation.
That took 30 seconds. No digging through projects. No asking team members for updates in Slack. No spreadsheet someone forgot to update. The data is live because it flows from the same workspace where your team does the actual work.
Connecting The Big Board to Your Daily Operations
The Big Board is your strategic view, but it needs to connect to tactical execution. Here’s how to link them.
Use Relationships
ClickUp’s Relationships feature lets you link client portfolio tasks to their actual project tasks. From the Big Board, click into “Acme Corp” and see every active project, deliverable, and milestone connected to that client. You get the strategic overview and the ability to drill into details when needed.
Automate Status Updates
Set up automations so when all tasks in a client’s project reach “Done” status, a comment is automatically added to their Big Board task. This creates a log of delivery milestones visible from the portfolio level.
You can also automate client status changes—if a task is marked “Blocked” for more than 48 hours on a Tier 1 client, automatically change the client’s priority flag to High on the Big Board.
Weekly Screenshot Ritual
Every Monday, take a screenshot of The Big Board and drop it into your team leadership channel. It becomes the agenda for your weekly operations meeting. Over time, you build a visual history of how your portfolio health evolves—and you can spot patterns like seasonal churn or capacity crunches before they hit.
Advanced: The Big Board for Non-Agency Businesses
The Big Board concept isn’t limited to agencies. Any service business with multiple clients or projects can adapt it.
Consulting firms: Group by engagement partner, track by project phase (Discovery, Analysis, Recommendations, Implementation).
Accounting firms: Group by partner or senior accountant, use Client Status to track tax season phases (Documents Requested, In Preparation, In Review, Filed).
Nonprofits: Group by program manager, track grant-funded projects by funding source and delivery status.
SaaS companies: Group by customer success manager, track by customer health score and renewal date.
The principle is universal: one view that shows your entire portfolio of relationships, organized by ownership, with enough context to make decisions without drilling into details.
What Most Teams Get Wrong
The most common mistake is trying to make The Big Board do too much. It’s not a project management view—it’s a portfolio management view. Keep these principles in mind:
One task per client, not per project. The Big Board shows client relationships, not work items. Link to projects using Relationships if you need the detail.
Update fields religiously. A Big Board with stale data is worse than no Big Board at all. Make field updates part of your weekly routine—or better yet, automate them.
Don’t over-customize. Start with the five core fields (Client Status, Services, Account Manager, Project Manager, Priority) and add more only when you have a specific question the current setup can’t answer.
Archive, don’t delete. When a client completes their engagement, change their status to Offboarding or Closed and archive the task. Never delete it. That historical data is valuable for understanding client lifecycle patterns and for onboarding new account managers who need to see past relationships.
Your Implementation Plan
You can build The Big Board this afternoon. Here’s the play:
Hour 1: Create your custom fields (Client Status, Services, Role fields, Client Value). Configure the options for each.
Hour 2: Create your Client Portfolio list and add a task for every active client. Populate the custom fields for each one.
Hour 3: Configure the List view—set your columns, group by Account Manager, save your filtered views.
Hour 4: Share with your team. Walk them through what each field means and establish the update cadence.
The agencies and service teams I work with that implement The Big Board typically see results within the first week. Missed client issues drop significantly because problems surface in the Monday morning view before they escalate. Account managers report feeling more in control because they can see their full portfolio without maintaining their own tracking spreadsheets. And leadership finally has the visibility they need to make strategic decisions about capacity, hiring, and client acquisition.
The question isn’t whether you need this level of visibility. You do. The question is whether you’ll build it proactively—or wait until the next client escalation forces you to.
Ready to Build Your Big Board?
Download our Big Board Setup Checklist for the complete field configuration guide, view setup instructions, and automation recipes that make the whole system run on autopilot.
Your Monday mornings are about to get a lot less stressful.